Is Meatloaf Still a Budget Dinner? 2026 Cost Breakdown
Meatloaf can still be a budget dinner in 2026, but mainly when one pound of beef becomes five or six satisfying portions or leaves enough to replace another meal. A four-serving loaf is not automatically cheaper than four quarter-pound patties: it starts with the same pound of beef and adds egg, breadcrumbs, and milk.
Using May 2026 Bureau of Labor Statistics (BLS) average prices, the amount used of those four core ingredients costs about $7.55. This is not the price of a finished loaf or complete dinner; it excludes onion, seasonings, glaze, and sides. The four-ingredient cost works out to $1.89 for four portions, $1.51 for five, or $1.26 for six. To test the value in your kitchen, add every other ingredient and side, divide by the portions actually eaten, and compare that complete per-portion cost with the alternative meal.
What The Partial $7.55 Estimate Includes
The $7.55 figure covers one pound of ground beef, one large egg, one-half cup of breadcrumbs, and one-third cup of milk. It is a consistent four-ingredient benchmark, not a claim about the full cost of a finished meatloaf dinner. Onion, Worcestershire sauce, salt, pepper, ketchup, glaze, side dishes, and similar additions vary by kitchen and are excluded.
The estimate prices the amount used in one loaf. A shopper starting with an empty pantry would pay more at checkout because stores sell whole onions and full packages of milk, eggs, bread, condiments, and seasonings. Most of those packages remain for other meals, so a full-package checkout total and this per-loaf amount-used estimate answer different questions.
| Portion plan | Four-ingredient cost per portion | What it assumes |
|---|---|---|
| 4 portions | $1.89 | Four larger slices; no automatic saving over four quarter-pound patties |
| 5 portions | $1.51 | Five useful slices from the same pound of beef |
| 6 portions | $1.26 | Six smaller slices served with filling sides |
For a complete-meal comparison, add the amount-used cost of onion, seasonings, glaze, and side dishes to $7.55. Divide that total by the portions actually eaten, then compare it with the amount-used cost of the alternative dinner. Count a whole package only when this meal consumes the whole package. The binder guide helps keep extra portions sliceable, while a leftover plan matters only when it replaces food you otherwise would have prepared or bought.
Beef Is About 94 Percent Of The Core Cost
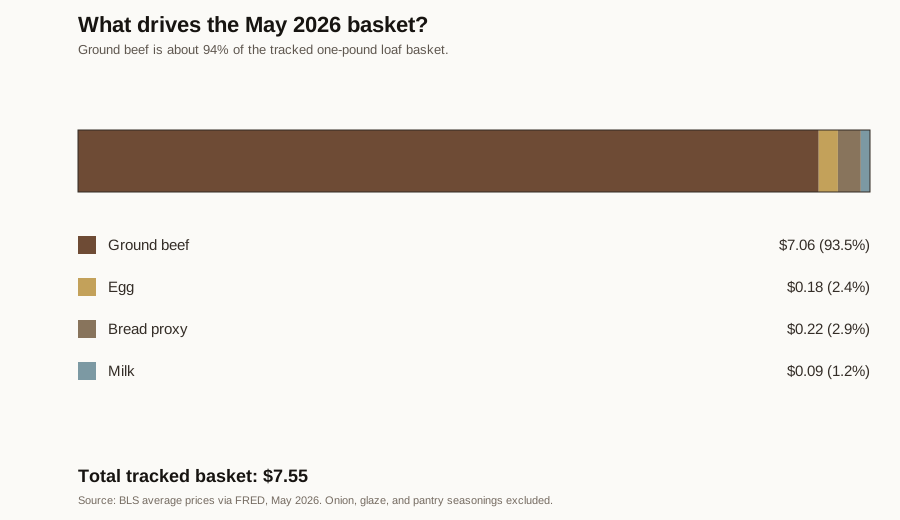
Ground beef accounts for about 94 percent of the four-ingredient benchmark: roughly $7.06 of the $7.55 total in May 2026. The remaining tracked amounts are about $0.18 for one egg, $0.22 for the white-bread estimate used for breadcrumbs, and $0.09 for milk.
Because one ingredient dominates the calculation, beef is the first place to compare prices. Binder affects texture and possible yield, but adding more binder does not create savings unless the finished meal produces another satisfying portion.
Useful cost decisions include:
- Compare per-pound prices among beef blends that work for the recipe.
- Keep the loaf to one pound instead of adding extra meat by habit.
- Decide before serving whether the loaf needs to make four larger portions or five to six smaller ones.
- Pair smaller slices with inexpensive, filling sides such as potatoes, beans, rice, or vegetables rather than counting thin slices alone as extra value.
- Reserve a planned leftover only when it will replace another lunch or dinner.
May Price Versus The 2026 Average
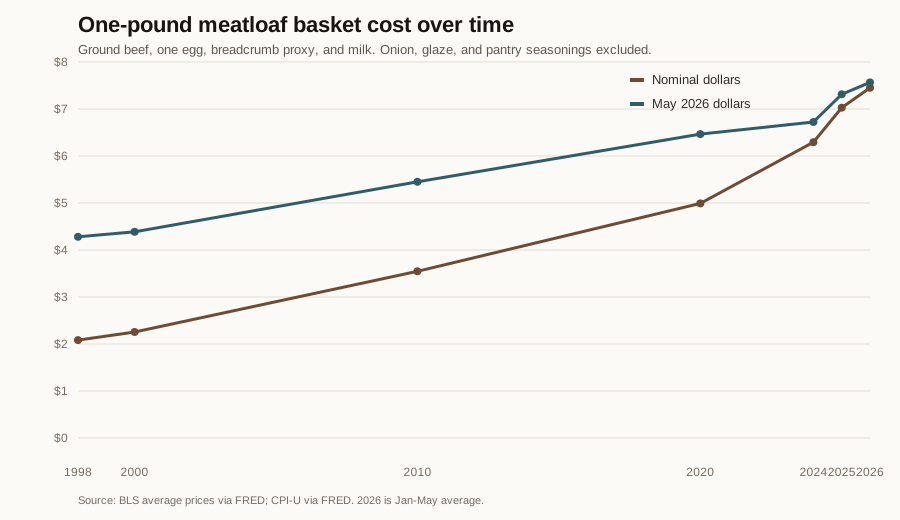
May's $7.55 core cost was slightly above the $7.45 nominal monthly average for January through May 2026. When each of those five months is translated into May purchasing power before averaging, the result is $7.57 in May 2026 dollars.
That adjustment uses the Consumer Price Index for All Urban Consumers (CPI-U). “Nominal” means the prices recorded at the time; “May 2026 dollars” puts different periods on a common purchasing-power basis.
For the longer comparison, the same core averaged $2.08 in 1998 dollars, or $4.28 in May 2026 dollars. In 2020 it averaged $4.99 nominal, or $6.47 in May 2026 dollars.
The January-through-May 2026 adjusted average is therefore roughly 77 percent above the 1998 average and roughly 17 percent above the 2020 average. Those comparisons describe the same four ingredients in every period, not a complete meal or grocery receipt. Because beef dominates this benchmark and its inflation-adjusted cost has risen, serving yield now matters more to the budget case than the few cents contributed by binder and milk.
Methodology And Source Checks
The calculation uses BLS average retail prices retrieved through FRED, the Federal Reserve Bank of St. Louis's public economic database. BLS collects the price data; FRED is the retrieval path.
The exact inputs and conversions are:
- One pound of all uncooked ground beef, series `APU0000FC1101`: $7.064 in May 2026.
- One large egg, priced as one-twelfth of the dozen-egg series APU0000708111.
- One-half cup of dry breadcrumbs, estimated as 54 grams or 0.119 pound of white pan bread from series APU0000702111.
- One-third cup of whole milk, priced as one-forty-eighth of a gallon from series APU0000709112.
White bread is a proxy because there is no clean long-running BLS breadcrumb series. It creates a consistent amount-based comparison over time; it is not a claim that a package of dry breadcrumbs has the same shelf price. The unrounded derived totals are $7.552 for May 2026, $7.452 for the January-through-May nominal average, and $7.566 for that five-month average in May 2026 dollars.
Direct BLS API spot checks matched the FRED values for sampled months. A separate 100 percent ground beef series and USDA ERS meat price data also agree at $6.745 per pound, or 674.5 cents, for May; USDA's documentation explains that its retail prices are based on BLS data. Beef Magazine's August 2014 and January 2015 reports, plus KCRA/Hearst's June 2025 report, provide additional historical spot checks but are not calculation inputs.
What Recipe Ratios Can Show
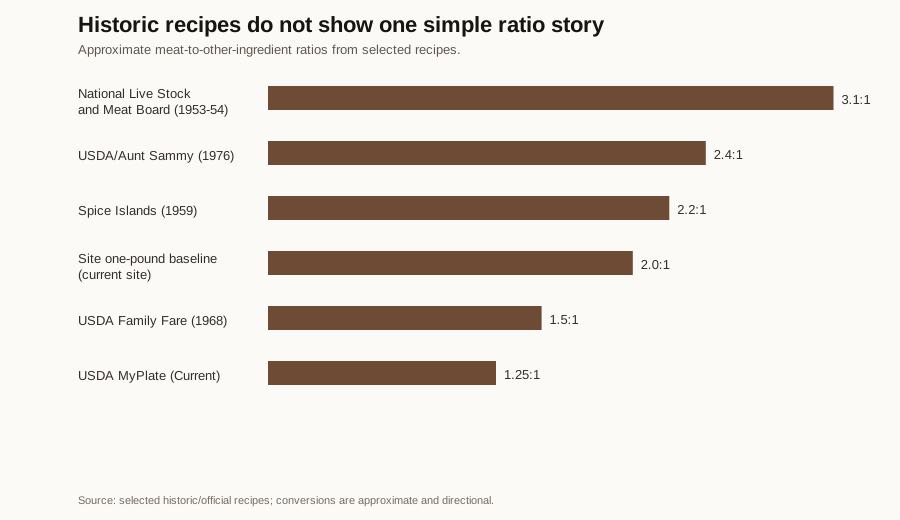
The historical ratios show how flexible meatloaf formulas can be; they do not prove that a particular loaf is cheaper. Each ratio compares meat by estimated weight with the combined estimated weight of measured binder, liquid, egg, onion, and vegetables. A ratio of 3.1:1, for example, means about 3.1 parts meat for every one part of those other measured ingredients.
The 1953-54 National Live Stock and Meat Board loaf is meat-heavy at about 3.1:1. The revised 1968 USDA Family Fare loaf is about 1.5:1, while the modern MyPlate loaf is about 1.2:1 to 1.3:1, partly because it includes more vegetables.
The chart's broader sample also includes meatloaves from Aunt Sammy's Radio Recipes and the Spice Islands Cook Book. The budget connection is potential yield, not the ratio by itself. More non-meat structure may help create a fifth or sixth portion, but it counts as value only if that portion is satisfying and actually replaces other food. This small sample does not show a steady historical march toward thriftier loaves.
A Simple Budget Decision Rule
Use this worksheet for the dinner you actually make:
- Add the amount-used cost of beef, egg, binder, milk, onion, seasoning, glaze, and sides.
- Divide by the number of portions actually eaten, including a leftover only when it replaces another meal.
- Compare that per-portion result with the complete alternative dinner, not with beef alone.
For example, suppose the amount-used cost of your onion, seasonings, glaze, and sides is $2.45. Adding that to the $7.55 benchmark gives a $10 complete-meal total, or $2.50 for four portions, $2.00 for five, and $1.67 for six. The $2.45 is an illustration, not a national price estimate; replace it with what you actually use.
Compare that result with the full cost per portion of the dinner you would make instead. The meatloaf earns its budget reputation only when the fifth or sixth portion is satisfying, or when a leftover genuinely replaces another lunch or dinner.
References
- BLS/FRED: All uncooked ground beef average price
- USDA ERS: Meat Price Spreads
- Beef Magazine: Retail Beef And The Ground Beef Market
- Beef Magazine: Does Beef Price At Retail Matter Anymore?
- KCRA/Hearst: Why Ground Beef Prices Are Soaring
- USDA Family Fare: Meat Loaf
- National Live Stock And Meat Board: Family Meat Loaf
- BLS/FRED: 100% ground beef average price
- BLS/FRED: Fresh whole milk average price
- BLS/FRED: Grade A large egg average price
- BLS/FRED: White bread average price
- BLS/FRED: Consumer Price Index for All Urban Consumers
- USDA ERS: Meat Price Spreads Documentation
- Aunt Sammy's Radio Recipes: Meat Loaf
- Spice Islands Cook Book: Meat Loaf
- MyPlate: Glazed Meatloaf